Feb 04 2021
Is Dunning-Kruger a Statistical Artifact?
 The short answer to the headline question is – not really, but it’s complicated.
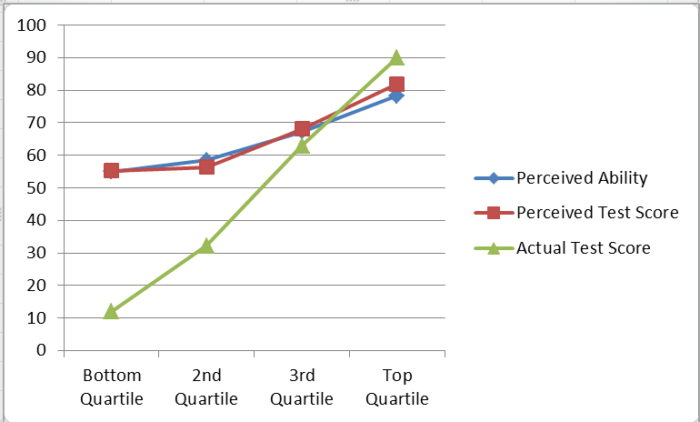
The Dunning-Kruger effect, which I have written about several times before, was first published in 1999 by the named psychologists. The basic effect is this – if you graph self-perception of knowledge in a specific domain and performance on an objective test of that knowledge, there is a typical graph of the relationship between these two things. Specifically, the less people know, the more they overestimate their knowledge. They still rate themselves lower than people who know more, but the gap between perception and reality grows. Further, at the high end (the top quartile) people actually underestimate their relative knowledge, probably because they overestimate average knowledge in the public. And everyone thinks they are above average.
This effect is extremely robust and has been replicated many times in many contexts. As the authors have emphasized before – the DK effect is not about stupid people, it is about everybody. It is not about intelligence, but knowledge.
There is also a distinct effect some are calling a super-DK effect in which in specific knowledge areas, like genetic engineering, the people who low the least think they know the most. This is not just about knowledge, but about misinformation. If people are actively misinformed they will have the illusion of knowledge.
The DK effect has been a cornerstone of science communication and our understanding of how to improve knowledge in the last two decades. However, a recent study calls the basic effect into question – The Dunning-Kruger effect is (mostly) a statistical artefact: Valid approaches to testing the hypothesis with individual differences data. The study essentially showed you can reproduce the DK graph using a randomly generated set of data. How is this possible?
The authors argue that there are other effects at work. One effect is purely statistical – a type of regression to the mean. The authors argue that what is really going on is that the less knowledge you have the less accurately you assess your own knowledge. OK, so far that agrees with the DK effect. But, they argue, (this is where regression to the mean kicks in) the lower you are on the graph of actual ability the more opportunity there is to overestimate rather than underestimate your knowledge. The same is true at the top – the most knowledgeable people can only underestimate their relative knowledge. Both ends are regressing a bit toward the middle, causing the classic DK graph.
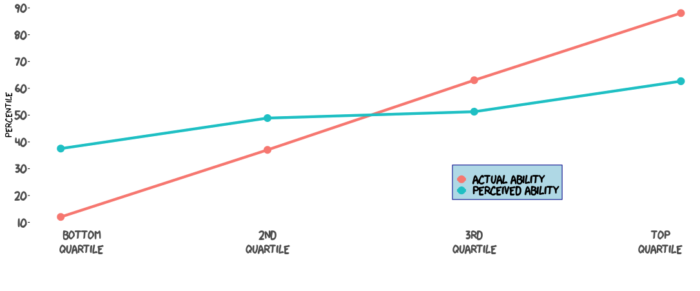
But if you look at the two graphs they are not identical. The graph of random data is more symmetrical, and less pronounced. So, the authors argue, the difference is due to a known effect – the overconfidence bias. People tend to overestimate their own ability, and most people think they are above average. Therefore DK is not its own effect, but is just a combination of factors – the inverse relationship between knowledge and accuracy of self-assessment, regression to the mean, and the overconfidence effect.
 My problem with this framing is that this seems like a distinction without a difference. First, Dunning and Kruger acknowledged in their original 1999 paper that their graph is likely to be partly regression to the mean. This is not a new idea. Further, DK is an effect, not a specific bias. The new paper, if anything, helps clarify what constitutes that effect, but it does not mean the effect is not real (as far too many people are reporting). The DK effect is very real, robust, and highly replicable. In fact, that is how I have always understood the effect – the less you know about a topic the less accurately you can assess your own knowledge, and people tend to be overconfident.
This is part of a more general phenomenon we see in pretty much all of science – the greater the error or noise in the data, the more we see the effects of bias. Less rigorous studies tend to be false positives, because there is more room for researcher bias, which is biased towards confirming their hypothesis. As you improve rigor, bias tends to become less. And sure, there is some regression to the mean in that graph. If you are at the very lowest quartile and you very inaccurately assess your own knowledge, you can only overestimate it, and there is a lot of head room in which to do so.
There are also likely other effects in there as well, and the exact graph is likely to be different with different cultures, demographic populations, and topic areas (and there is copious evidence for all this). For example, in some knowledge areas there is likely an “unknown unknowns” effect. Not only is your overall ability to self-assess less accurate, you simply don’t know what you don’t know. Many readers have likely experienced when they first start to study an area, and they realize that the knowledge space is vastly greater than they previously assumed. Suddenly you realize how relatively little you know. I remember experiencing this acutely when I was starting my fellowship in neuromuscular disease. Medical training itself is a repeated experience in humility and being hammered with your relative lack of knowledge. But I remember at one point seeing in the small library assembled for the neuromuscular program a giant two-volume set on just muscle disease. The size of those volumes represented my ignorance – even after completing my neurology residency.
The more accurate bottom line, therefore, is that the DK effect is real but complicated, consisting of some regression to the mean but also a clear relationship between knowledge and the ability to self-assess and a generic overconfidence bias, plus a host of context specific effects. The net effect of all this is the DK graph. Even people at the very bottom of the relative knowledge spectrum will still assess their own knowledge as being above average.
Finally, I do want to point out that I love this kind of research, that takes a look at the deeper phenomenon behind even a widely accepted effect, and is not afraid to ask basic questions about its validity. This is science in action, and it does give us a deeper understanding of the phenomenon. Also, psychological effects are always complicated, because people are complicated and extremely variable. Psychological studies are typically based on research constructs – a hypothesis about the thought processes of subjects. But these constructs are just that – models. They are approximations at best, attempting to tease out one effect from the complicated mess that is the functioning of a human mind. This still can lead to actionable and usable knowledge, but we have to understand its limits and complexity. This is just one good example of that.